
CliQ Employer Pulse Index – H1 2026 Report: CEO Approval Declines
WHAT’S INSIDE
I want CliQ Updates!
CliQ Employer Pulse Index · H1 2026
Employees haven’t soured on their companies. They’ve soured on leadership.
Using archived Glassdoor data acquired through the Internet Archive Wayback Machine, we analyzed how employee ratings and CEO approval have shifted across the 2026 class of the US Fortune 500. Each company was measured from a usable archived anchor in or around 2020 (some variations exist due to limited snapshot availability) to a reading acquired in 2026. Across the 475 employers with parseable readings at two points and a pre-2026 anchor, the pattern is noticeably consistent: overall employee ratings are effectively flat across the cohort, while employee confidence in CEOs (and by extension, senior leadership) has fallen at nearly two-thirds of America’s corporate pillar companies by an average of more than ten points.
As of July 2026. Each figure represents an early snapshot of each company where a pre-2026 snapshot is available, and a snapshot or manual data review taken between June and July 2026. Most anchor snapshots are within 1–2 years of 2020 (prior or after), while one company has its earliest anchor point in 2013. Live values may have moved since the most recent snapshot. These are point-in-time readings, not real-time.
Our inaugural Employer Pulse Index reveals a very significant divergence in employee sentiment: the different feelings workers have for the company as an entity versus the feelings they have for their company’s leadership, as expressed through how they feel about and rate their organization’s chief executive. While the Fortune 500 isn’t exactly a popularity contest, and Glassdoor data does not weigh into a company’s rankings or position on the list, employee sentiment should be seen as a strong signal of future success.
Across the Fortune 500, overall Glassdoor ratings barely moved. Yet confidence in the CEO fell at 65% of America’s industry leaders — by an average of about ten points.
That gap is, quite literally, the story worth telling here. Combined with our CliQ People Index data showing what aspects of the employee experience workers feel most strongly about (both positively and negatively), the data is screaming a signal employers can’t ignore. The workforce has an uncanny ability to differentiate between the workplace and work environment, and the leaders dictate the overall workplace experience. Additionally, the steepest drops in CEO sentiment aren’t confined to troubled sectors; they cut across banking, tech, hospitality and pharma alike, and they’re sharpest where a new CEO arrived mid-window.
It’s tempting to read a falling approval score as a morale problem to be surveyed away. The data suggests the opposite. Employees are telling their leaders, publicly in Glassdoor data, and anonymously on public forums like Reddit, that the instruments of engagement like the annual pulse and the day-to-day work experience have lost credibility and acceptability. Trust isn’t rebuilt by measuring it more often or changing underperforming leaders every few years. It’s rebuilt by the slower work these numbers point to: visible career paths, real mentorship, and consistent leaders who are close enough to their people to hear the discontent before it turns up in an archive.
CliQ Employer Pulse Index · H1 2026 · reconstructed from archived Glassdoor data.
Read these against the baseline: employer (the company or organization) ratings sit in a narrow band — the index averages about 3.6 out of 5, with a tight spread (most companies within about three-tenths of a point). In that compressed range a −0.2 slide is roughly a 5% drop that can push a company well below the pack, even though it barely registers at a glance. CEO approval, by contrast, moves far more — and it moved down, from an index average of about 80 to 69.
The divergence, in one chart
Here is the whole finding in a single view. For each industry group, the teal bar is how much employees changed their rating of the company; the red bar is how much they changed their rating of the CEO. Both are shown as percentage change from each company’s own archived baseline, so the two sit on one comparable scale.
Every one of the 18 industry groups lost CEO approval — by between 5.8% and 23.6% — while company ratings moved a fraction as far, and actually rose in eight of them. Not one group posted a net gain in leadership trust. The slide is steepest in hospitality & food service (−23.6%, or −19.7 points), with food & consumer manufacturing, banking and media close behind, and tech and financial services next. It holds up best — though still negative — in real estate & construction, frontline healthcare and advanced manufacturing. What the chart makes plain is that overall ratings barely moved in any sector: the movement is chiefly in employees’ confidence in their company leadership, not the workplace itself. As we track this over time, we’ll be looking to see how these numbers shift as the economic environment changes.
Percentage change from each company’s archived anchor to its latest reading, averaged within each industry group. Note these are percentage changes, shown this way so a 1–5 star rating and a 0–100% approval score can share one axis — the tables elsewhere on this page report the same movement in points. In absolute terms the index rating went 3.64 → 3.65 while approval went 79.7% → 69.3%. All 18 F500 industry groups are shown; per-industry company counts are in the industry scorecard below, where the smallest bucket (Consulting, n=7) still clears the n < 3 suppression threshold. Directional, not survey-grade.
The trust free-fall
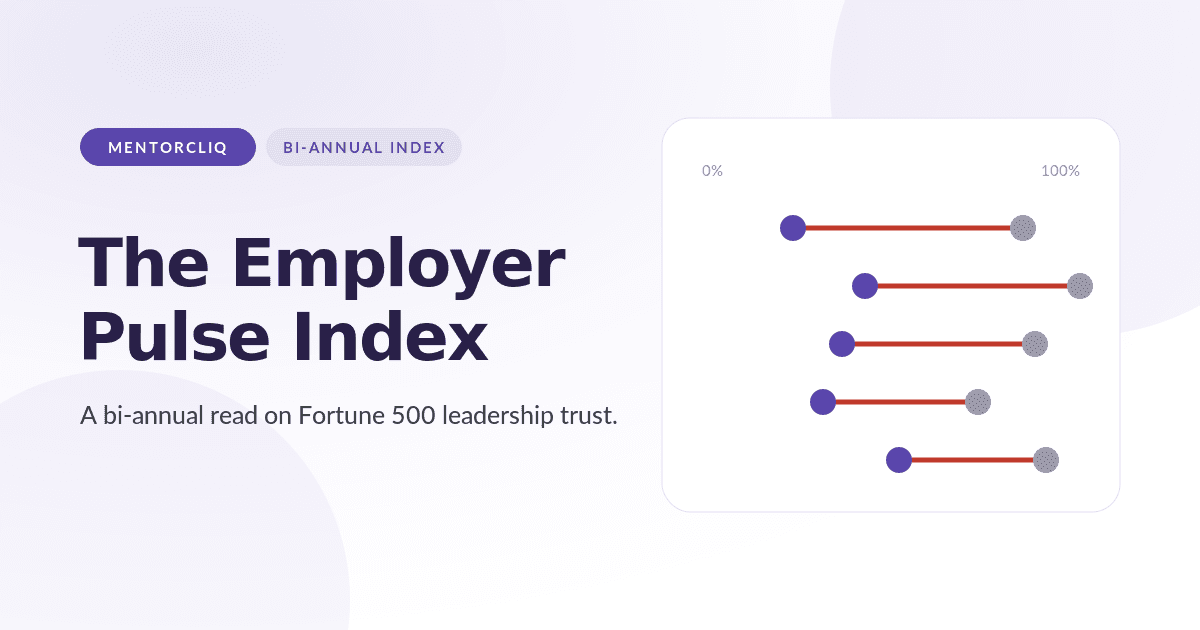
Ten of the steepest collapses in CEO approval since each company’s archived baseline. Each dumbbell runs from where they were to where they are — every one of these employers lost 44 points or more.
| 0%100% | |||
| Voya Financial | 85 → 24 | −61 | |
| EchoStar | 91 → 32 | −59 | |
| Truist Financial | 100 → 43 | −57 | |
| Xcel Energy | 88 → 33 | −55 | |
| Caesars Entertainment | 99 → 46 | −53 | |
| PVH | 91 → 39 | −52 | |
| Meta Platforms | 88 → 37 | −51 | |
| C.H. Robinson Worldwide | 88 → 41 | −47 | |
| Fannie Mae | 89 → 44 | −45 | |
| Crown Holdings | 83 → 39 | −44 |
Each row is a dumbbell: the grey dot is the archived baseline, the violet dot the latest reading; the bar is the decline. Values show baseline → latest CEO-approval (%). Baseline = each company’s earliest archived reading (various years). Directional, not survey-grade.
A handful ran the other way — Devon Energy rose most (31 → 77), alongside CSX (25 → 67), Occidental Petroleum and Community Health Systems. “Rose” is a direction, not a verdict on the workplace, and most risers here started from a low base.
When the rating holds but the boss doesn’t
Sorting of the companies with parseable ratings by whether their company rating and CEO approval each rose or fell. Approval fell at 350 of them (74%) — and at 148, the overall rating actually held or improved while confidence in the CEO dropped. Leadership trust erodes before the headline number does. (Noting, again, that some companies did not have a pre-2026 anchor, so were excluded to avoid muting the averages.)
| Overall rating fell | Overall rating held or rose | |
| CEO approval held or rose | 15 rating dipped, but the CEO rating held steady or improved | 106 holding on both fronts |
| CEO approval fell | 202 both eroded together | 148 rating steady — but they lost faith in the CEO |
471 employers with both a rating and a CEO-approval change vs. baseline. “Held or rose” includes no change. Directional, not survey-grade.
The top of the class emptied out
Every Fortune 500 employer’s CEO-approval score, at its archived baseline vs. today, as two distributions. The whole curve slid left. Average approval fell from 80 to 69, and the mass of CEOs that used to pile up above 85% has thinned out and spread down into the 50s and 60s.
471 employers with a baseline and latest CEO-approval reading. Curves are smoothed distributions; dashed line = baseline average, solid = latest average. Directional, not survey-grade.
The 80%+ club emptied out
Employers grouped by CEO-approval band, at their archived baseline vs. their latest reading. The top band (80%+) halved, from 58% of employers to 30%, while the sub-60 group nearly tripled — from 9% to 24%.
Share of the 471 employers with a baseline and latest CEO-approval reading, by band. Directional, not survey-grade.
The industry scorecard
Every Fortune 500 industry group across five signals at once — workplace rating and its trend, the leadership-trust drop, how widely it spread (share down 5+), and the engagement–stock divergence. Cyan reads as strength, red as decline, violet as divergence intensity. Sorted by CEO-approval decline.
| Industry | n | Rating | Rating Δ | CEO appr Δ | Down 5+ | Diverg. |
|---|---|---|---|---|---|---|
| 10 | 3.63 | −0.11 | −19.7 | 90% | 20% | |
| 17 | 3.61 | −0.04 | −15.7 | 82% | 29% | |
| 44 | 3.61 | −0.05 | −15.7 | 77% | 5% | |
| 39 | 3.69 | −0.12 | −14.3 | 77% | 12% | |
| 32 | 3.70 | −0.01 | −14.2 | 75% | 18% | |
| 8 | 3.66 | −0.14 | −12.8 | 62% | 12% | |
| 46 | 3.58 | +0.00 | −11.3 | 65% | 14% | |
| 17 | 3.75 | +0.02 | −10.6 | 71% | 19% | |
| 25 | 3.81 | +0.11 | −10.5 | 68% | 0% | |
| 7 | 3.41 | −0.19 | −10.4 | 43% | 0% | |
| 48 | 3.42 | −0.02 | −10.3 | 62% | 13% | |
| 48 | 3.71 | −0.05 | −8.2 | 56% | 20% | |
| 27 | 3.70 | +0.03 | −6.8 | 65% | 19% | |
| 26 | 3.72 | +0.22 | −6.0 | 56% | 8% | |
| 11 | 3.28 | +0.09 | −5.9 | 55% | 20% | |
| 32 | 3.83 | +0.02 | −5.3 | 44% | 29% | |
| 24 | 3.80 | +0.15 | −4.8 | 52% | 24% | |
| 14 | 3.39 | +0.06 | −4.3 | 57% | 31% |
Latest company rating (out of 5) and CEO-approval / rating change (points), anchor → latest · n = companies in group. Divergence = share whose rating fell while the stock matched or beat the S&P 500. Directional, not survey-grade.
Companies that changed CEO vs. those that didn’t
When we split the index by whether a company changed CEO in the window, we find the cohort that swapped leaders saw a larger approval slide and was more likely to cross the 5-point decline threshold. We’ll note here that that’s an association, not proof of cause. A change can follow a slide as easily as trigger one. But it’s the pattern in the data, and something companies should weigh carefully as they progress through leadership changes and change management processes and strategies.
The flat average hides a split
The index-wide rating move is essentially zero, but that average masks two very different groups. Where company ratings fell by a statistically significant amount, CEO approval fell with them, and far harder. And where those ratings rose, approval essentially held. Employee sentiment and confidence in leadership tend to move together, but the downside is decidedly amplified. A modest slide in the workplace experience coincides with a leadership-approval drop several times its size.
Employers split by the direction of their employee-rating change (anchor prior to 2026). The two groups roughly cancel on rating, which is why the index-wide average looks flat — but they diverge sharply on leadership approval.
Movement since the last index
This is the first CliQ Employer Pulse Index, so it sets the baseline: an index-average CEO approval of 69 and 65% of employers down 5+ points from their anchor year. Starting with the next bi-annual pull, this section reports how each of those headline numbers has moved against the prior release.
The index over time
Each release adds a point to the trend below — the index’s average CEO approval and the share of employers down 5+ points, tracked release over release.
One point so far — the trend line begins with the next release.
When the stock and the workforce move apart
In 16% of the companies we could measure on both dimensions (69 of 441), employee ratings fell while the stock matched or beat the S&P 500 over the same window — a widening gap between what the market rewards and what employees experience. (On a simpler nominal basis, 32% saw ratings fall while the stock merely rose — but much of that just reflects the whole market climbing over each company’s window, which is why we lead with the market-relative figure.)
What employees are telling each other
Reading the public employee discussion behind these numbers, one pattern recurs regardless of industry or stock: the machinery of employee engagement and development is hobbling along instead of running. In most cases, employees have stopped trusting what it’s for, and in many areas, its availability and efficacy have been reduced through budget cuts or employees simply being too overburdened with work to take advantage of what’s available to them. The survey still goes out — workers watch it quietly drop the questions leadership doesn’t want answered, produce a meeting and little else, and treat development and engagement as the first thing to cut. The feedback loop is intact on paper and broken in practice.
In employees’ own words
“Good grief, how are you a CEO when you can’t manage people? … please, work with an executive coach on leadership development.”
“Our yearly employee engagement surveys just ask if we have what we need but stopped asking questions like our faith in sr leadership. They didn’t like the answers.”
“Bottom-performing sites typically have a leadership development issue and are unable to see the big picture.”
“It’s a whole company culture. Like this is who they are from the CEO down.”
“He also commutes from friggin Iowa on the corporate jet and then demanded everyone return to office full time.”
“That manager doesn’t even realize she cost herself more money by losing that new hire in a single comment.”
“The companies that hire me do it because I have a solid track record of cleaning up the culture… I focus on leadership development and I don’t tolerate bad managers.”
“Find your management style and lean into it but always take care of your people, not every style resonates with every report, so you may have to be flexible.”
Public posts from employee forums, quoted verbatim and linked. These illustrate the pattern above, not a representative sample — forum discussion skews toward the vocal and the frustrated.
A fuller, monthly read of employee sentiment lives in the companion CliQ People Index.
What it means for people leaders
Leadership trust erodes quietly and shows up in the numbers late. The gap is fillable, and the levers are known: structured onboarding and mentoring, transparent career pathways, real community through ERGs, and leaders who listen inside the organization rather than reading about it outside. MentorcliQ’s career, skills, and community pillars are built to rebuild exactly that connective tissue — verified internal networks in place of anonymous ones.
See what your workforce would say
MentorcliQ helps people leaders rebuild trust through mentorship, career pathways, and community.
Experience a live demoTrend comparisons vs. the prior release appear starting with the next bi-annual pull.
Modal